LEARN BASIC EXCEL FOR NURSES
What is Excel? A beginner's overview
Excel is a software program from Microsoft that is
part of the Microsoft Office suite of productivity software developed by
Microsoft. Excel was originally code-named Odyssey during development at
Microsoft, and it was first released on September 30, 1985.
Excel is capable of creating and editing spreadsheets
that are saved with a .xls or .xlsx file extension. General uses of Excel
include cell-based calculation, pivot tables, and various graphing tools. For
instance, with an Excel spreadsheet, you could create a monthly budget, track
business expenses, or sort and organize large amounts of data.
What is Excel used for?
Excel is typically used to organize data and perform
financial analysis. It is used across
all business functions and at companies from small to large. The main uses of Excel include:Data entry, data management, accounting, financial analysis, charting and graphing, programming, time management, task management, financial modeling, customer relationship management (CRM) and almost
anything that needs to be organized.
Why do people use excel?
This software can be used to store
and organize many data sets. Using its features and formulas, you can also use
the tool to make sense of your data. For example, you could use a spreadsheet
to track data and automatically see sums averages and totals. Next best use of
MS Excel is that it makes easy for you to solve complex mathematical problems
in a much simpler way without much manual effort.
Intro to Excel!
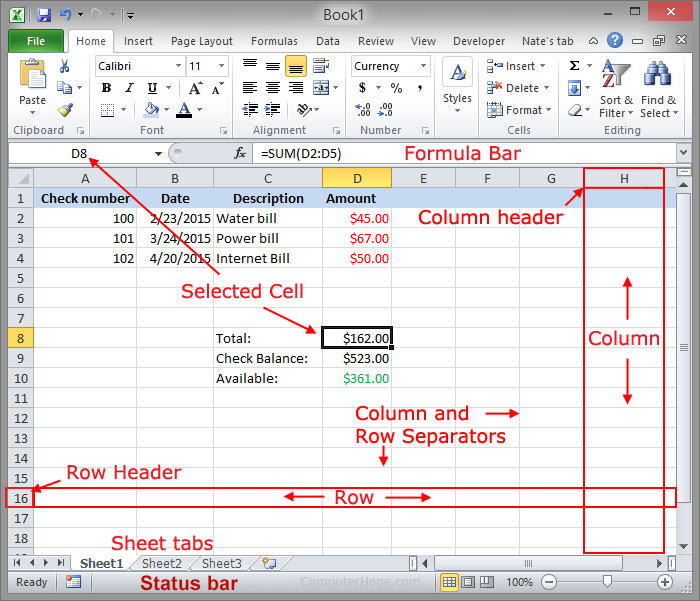
Below is an example of Microsoft Excel with each of
its major sections highlighted. See the formula bar, cell, column, row, or
sheet tab links for further information about each of these sections.
How Excel Works?
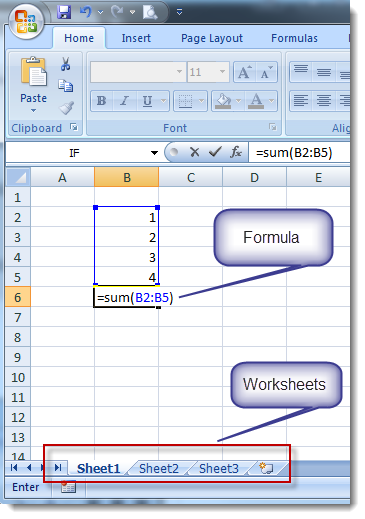
An excel document is called a Workbook. A workbook always has at least one Worksheet.
Worksheets are the grid where you can store and calculate data. You can have
many worksheets stored inside a workbook, each with a unique worksheet name.
What is a workbook?
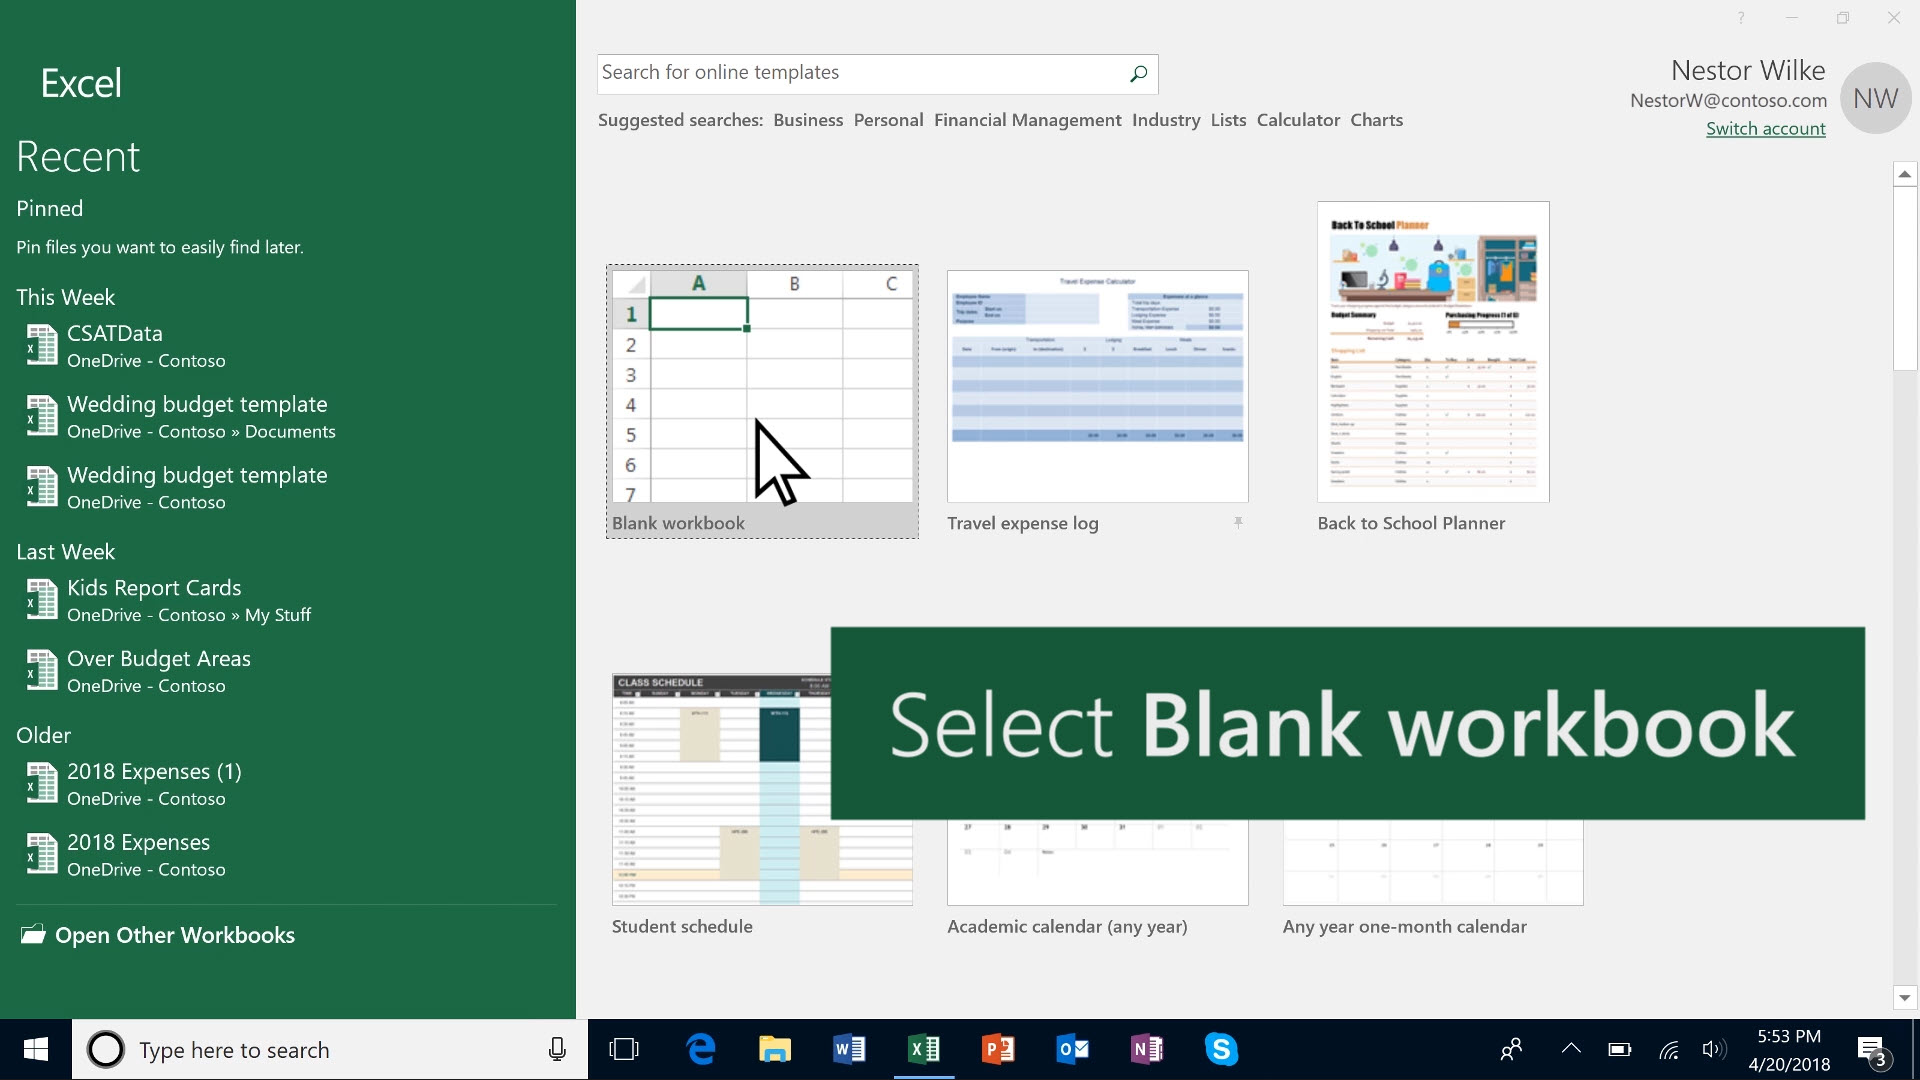
Once Excel has started, you will see a workbook and several
palettes containing commands.This workbook is divided into cells, boxes
designed to hold one data entry each. Each cell can be referred to by a letter
number address.
Major Uses for Excel
1. Entering Data
Entering Data into a cell is easy. Just select the
cell you want to start in with the mouse (A1 is fine), and type in your first
data entry. When you have finished with the cell press enter (not return.)
Notice that your typing is echoed in the console; you can edit the contents of
a cell by selecting the cell and then correcting the entry in the console.
2. Excel Formulas
You can create simple and complex formulas in Excel to
calculate just about anything.
3. Excel Charting
Excel offers a wide array of charts to visualize
data. They range from simple line graphs
to bubble and radar charts. Excel has
two main tools for charting: standard
charts and pivot charts.
4. Excel vs Word Tables
A common question is when to use the table layouts in
Word, and when to use Excel to present a list.
Both have important features appropriate for specific uses. Even if you have a Word document where you
want to display tabular information, the easiest path may be to embedd an Excel
sheet within the Word document.
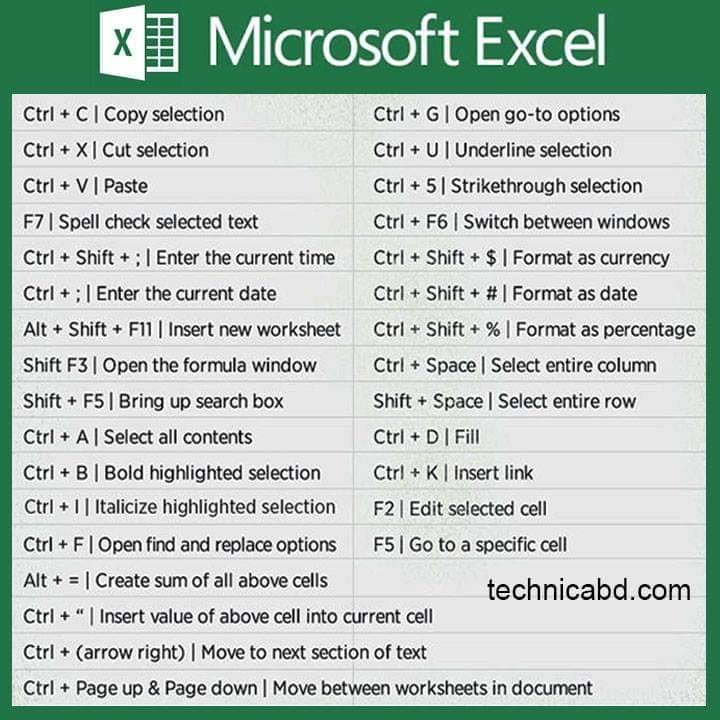
Microsoft Excel shortcut key:
This shortcut keys will helps you work effectively while working with text, numbers, and date information in a relatively open and unstructured way.
How to Use Excel:
A Brief MS Excel Tutorial
Understanding Your Main Screen
When you first open Excel in Office 365 or a newer
version of Microsoft Office, you’ll see a basic screen. Here are the key
features in this view:
1. The spreadsheets
A spreadsheet is a special way of organizing data into rows and columns to make it simpler to read and manipulate. Here's a screenshot of a black spreadsheet.
:max_bytes(150000):strip_icc():format(webp)/RowsandColumns-5a690dd96edd650037ee83cd.jpg)
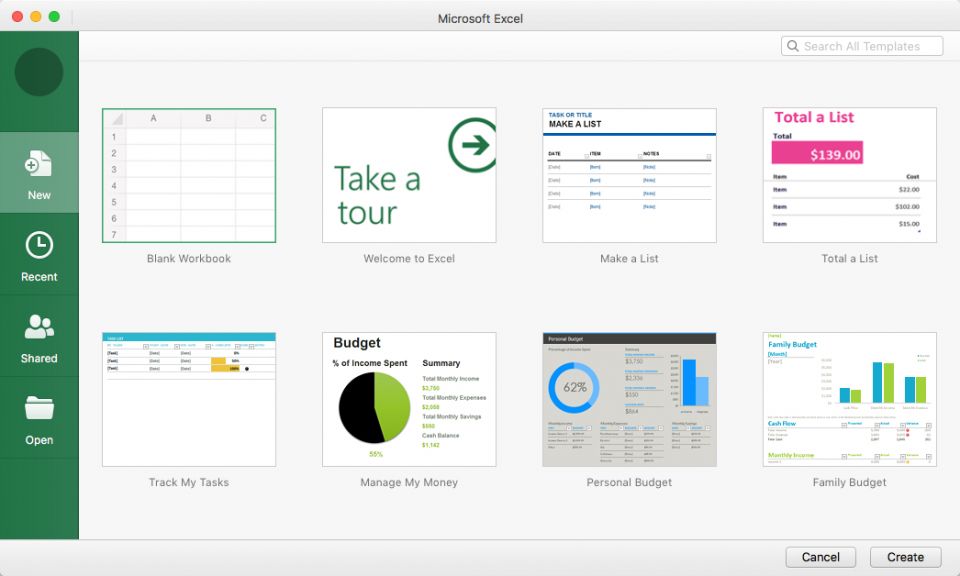
2: Create a Workbook
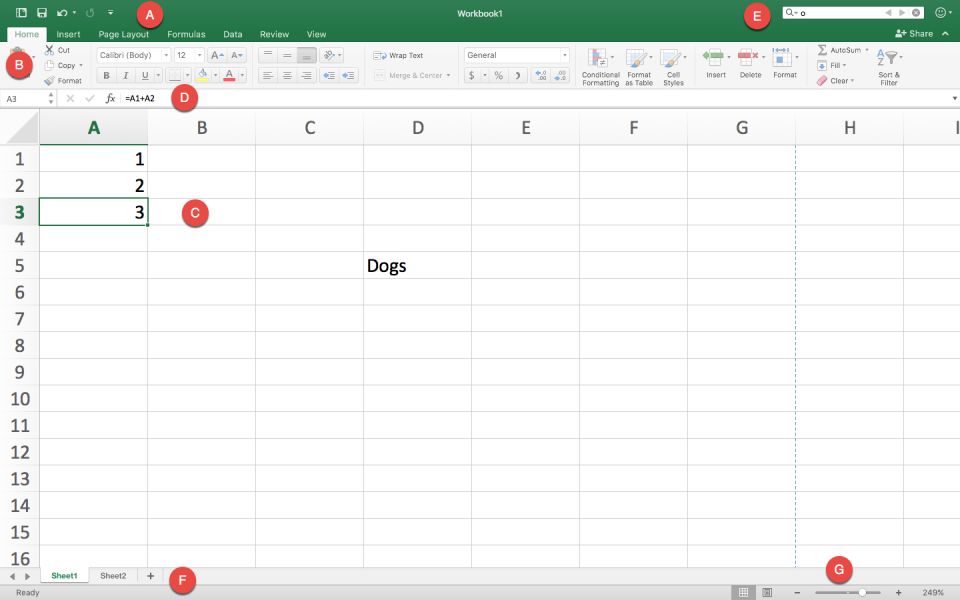
A. Basic App Functions: From left to right along this top
green banner you’ll find icons to: reopen the Create a Workbook page; save your
work; undo the last action performed and display which actions were recorded;
redo a step that’s been undone; select which tools appear below.
B. Ribbon:This grey area is called the Ribbon, and contains
tools for entering, manipulating, and visualizing data. There are also tabs
that focus on specific features. Home is selected by default; click on the
Insert, Page Layout, Formulas, Data, Review, or View tab to reveal a set of
tools unique to each tab. We’ll cover this more in the “Navigating the Ribbon”
section later on.
C. Spreadsheet Work Area: By default the work area is a
grid. Along the top are column headers A through Z (and beyond), and along the
left side are numbered row headers. Each rectangle in the spreadsheet is called
a cell, and they are each named according to their column letter and row
number. For example, the cell selected here is A3.
D. Formula Bar: The Formula Bar displays the information
contained within a highlighted single cell or range of cells. If in cell A1 you
entered “1” as a value, “1” will appear in the Formula Bar. Plain text that you
enter in a cell will also appear in the Formula Bar.
There are cases where what you see in the Formula Bar is
different than what’s in the cell. For example, let’s say A1 = 1 and A2 = 2. If
you create a formula in A3 that equals A1 + A2, then the A3 cell in your
worksheet would show “3,” but the Formula Bar would show “=A1+A2.” This is
important when you’re trying to move cells to other parts of your worksheet -
remember that the display “value” of a cell isn’t necessarily what the cell
contains.
E. Search Bar: Simply type the value you want to find to highlight
all cells containing that value. It doesn’t have to be an exact match. For
instance, if you searched for “o,” a cell labeled “Dogs” would appear among
your search results.
F. Sheet Tabs: This is where the different sheets in your
workbook can be found. Each sheet gets its own tab, which you can name
yourself. These can be useful to separate out data so that one sheet doesn’t
get too overwhelming. For example, you might have an annual budget, where each
month is a column, and each row is a type of expense. Instead of keeping every
single year you track on one sheet and scrolling horizontally, you can make
each tab a different year containing 12 months only.
G. Viewability Options: The left icon is Normal which shows
the worksheet as it appears in the image above, and the right icon is Page
Layout, which divides your worksheet into pages resembling how it would look
when printed, with the option to add headers. The slider with the “-” and “+”
on it is for scale or zoom-level. Drag the slider left or right to zoom in or
out.
3. Navigating the Ribbon
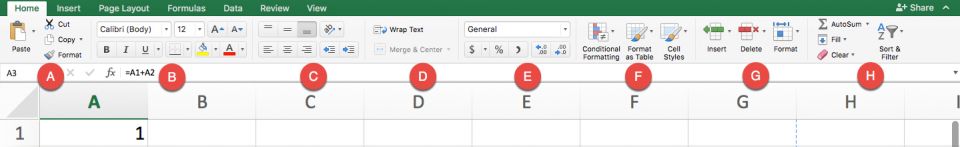
The Home tab is where you manage the formatting and
appearance of your sheet, along with some simple formulas you’ll always need.
A. Copy and Paste Tools: Use these tools to quickly
duplicate data and format styles in the spreadsheet.
B. Visual Formatting Tools:You can use the formatting tools
to change the font, size, and color of typed words, and make them bold,
italicized, or underlined. It also has a couple spreadsheet-specific formatting
options.
C. Position Formatting Tools: Align cell data to the top,
bottom, or middle of the cell.
D. Multi-cell Formatting Features: This section contains two
very important features that solve common problems for new Excel users. The
first is Wrap Text,when you enter text into a cell that extends beyond the size
of the cell, it spills into the next cell. Then the Merge and Center. There are
instances when you may want to combine several cells and have them act as one
long cell.
E. Numbers-based Format Settings: A drop-down menu has
options for number formatting. Often, you may use these tools on entire columns
to make all data in one category behave the same way.
F. Table or Sheet Formatting: Format as Table and Cell
Styles allow you to use presets or customize tables (for example, with
alternating row colors and highlighted header bars).
G. Row and Column Formatting Tools: The Insert drop-down
menu puts cells, rows, or columns before or after a selected area on the sheet,
and Delete removes them. The Format drop-down lets you change the height of
rows and the width of columns. It also has options for hiding and unhiding
certain sections.
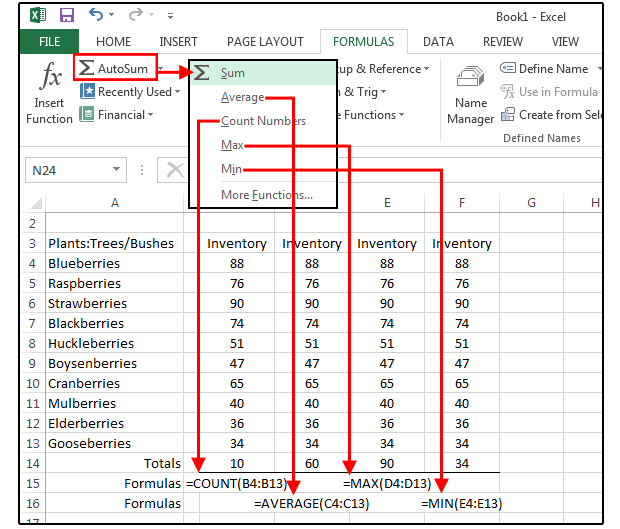
H. Miscellaneous Tools:Allows you to select a swath of cells
and place the sum in the cell located right below or directly to the right of
the last selected data point. You can use the drop-down to change the function
to calculate the average, display the maximum, minimum, or the count of numbers
selected.
Use the Insert tab to add extra elements to your Excel
workbook that go beyond text and colors.
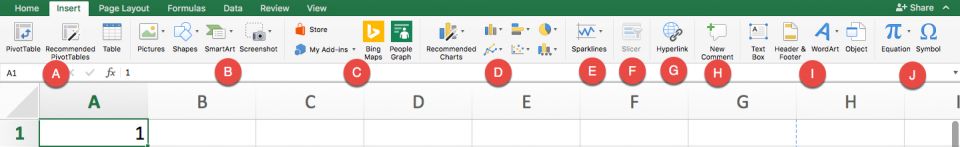
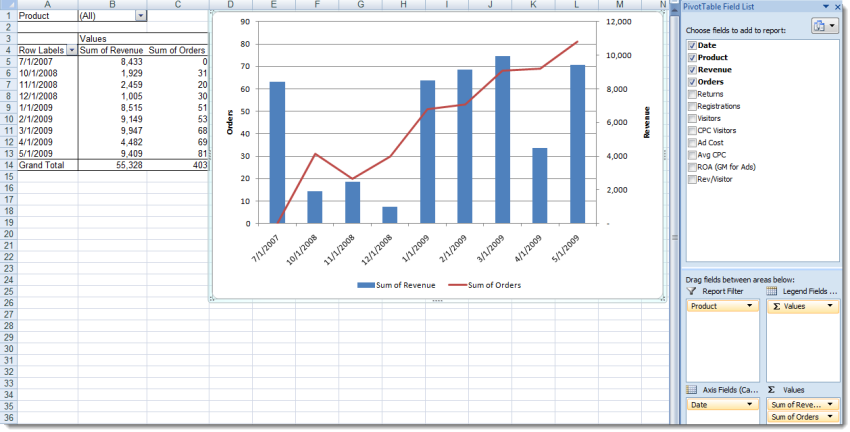
A. These tools control PivotTables, an important Excel
function. Think of PivotTables as “reports,” a quick way to view all your data,
analyze trends, and draw conclusions.
B. This section lets you insert visual elements, like
picture files, pre-built shapes, and SmartArt. They’re great for representing
what the data says in another place on your workbook.
C. These tools are for inserting elements from other
Microsoft products, like Bing Maps, pre-built information cards about People
(from Microsoft accounts only), and add-ins from their store.
D. Use these tools to create charts and graphs. Most of them
work only if you select one or more data sets (numbers only, with words for
headers or categories).
E. Sparklines are more simplistic graphs that can fit in as
little as one cell. You can place them next to data for a small, quick visual
representation.
F. Slicers are big lists of buttons that make your data more
interactive. You can select a PivotTable you’ve created, and then create a
slicer from it - this allows a viewer to click on buttons that correlate to the
data they want to filter.
G. This hyperlink tool allows you to make a cell or table
into a clickable link. Once a viewer clicks on the affected cell(s), they’ll be
taken to whatever website or intranet site you select.
H. Recent versions of Excel allow for better collaboration,
insert comments on any cell or range of cells to add more context.
I. A Text Box is useful when you’re creating a report and
don’t want typed words to behave like cells. It makes it easy to move your text
around, rather than cutting and pasting cells.
J. This section lets you insert Equations and Symbols. Use equations to write a math equation with
fractions, variables, and more that you can place in your sheet like a Text
Box.
This tutorial video provides a list of Excel basic formulas
and functions with examples and links to related in-depth tutorials.
Excel formula cheat sheet:
Uses of Microsoft Excel in Online access
MS Excel can be accessed online from anywhere and everywhere
which means that you can access it from any device and from any location
whenever you want. It provides the facility of working conveniently which means
that if you don’t have laptops then you can use mobile and do your work easily
without any problem.
Microsoft Excel for Nursing
Excel can also be used to keep track of medications,
prescriptions and other health information.
Some doctors are providing patients with a spreadsheet to
keep track of their health records. It’s a very helpful way to ensure that
patients who have to take medications on a schedule can follow that plan.
This teaches Nursing professionals and Nursing support staff
how to effectively use Microsoft Excel® for analyzing clinical, administrative
and financial information. All exercises and examples have been developed by
Nursing professionals using real-world scenarios and were created using data
from hospitals, long term care facilities, clinics, rehabilitation centers,
ambulatory surgical centers, home health organizations, behavioral health
organizations, private practices, and other healthcare settings.


